Towards Spring
-
Indoor season review
The indoor racing season did not go well. I had high expectations for the season since it came on the heels of a fall and winter full of excellent training. Below are the four races I did this winter, with my goal for the race in parentheses:
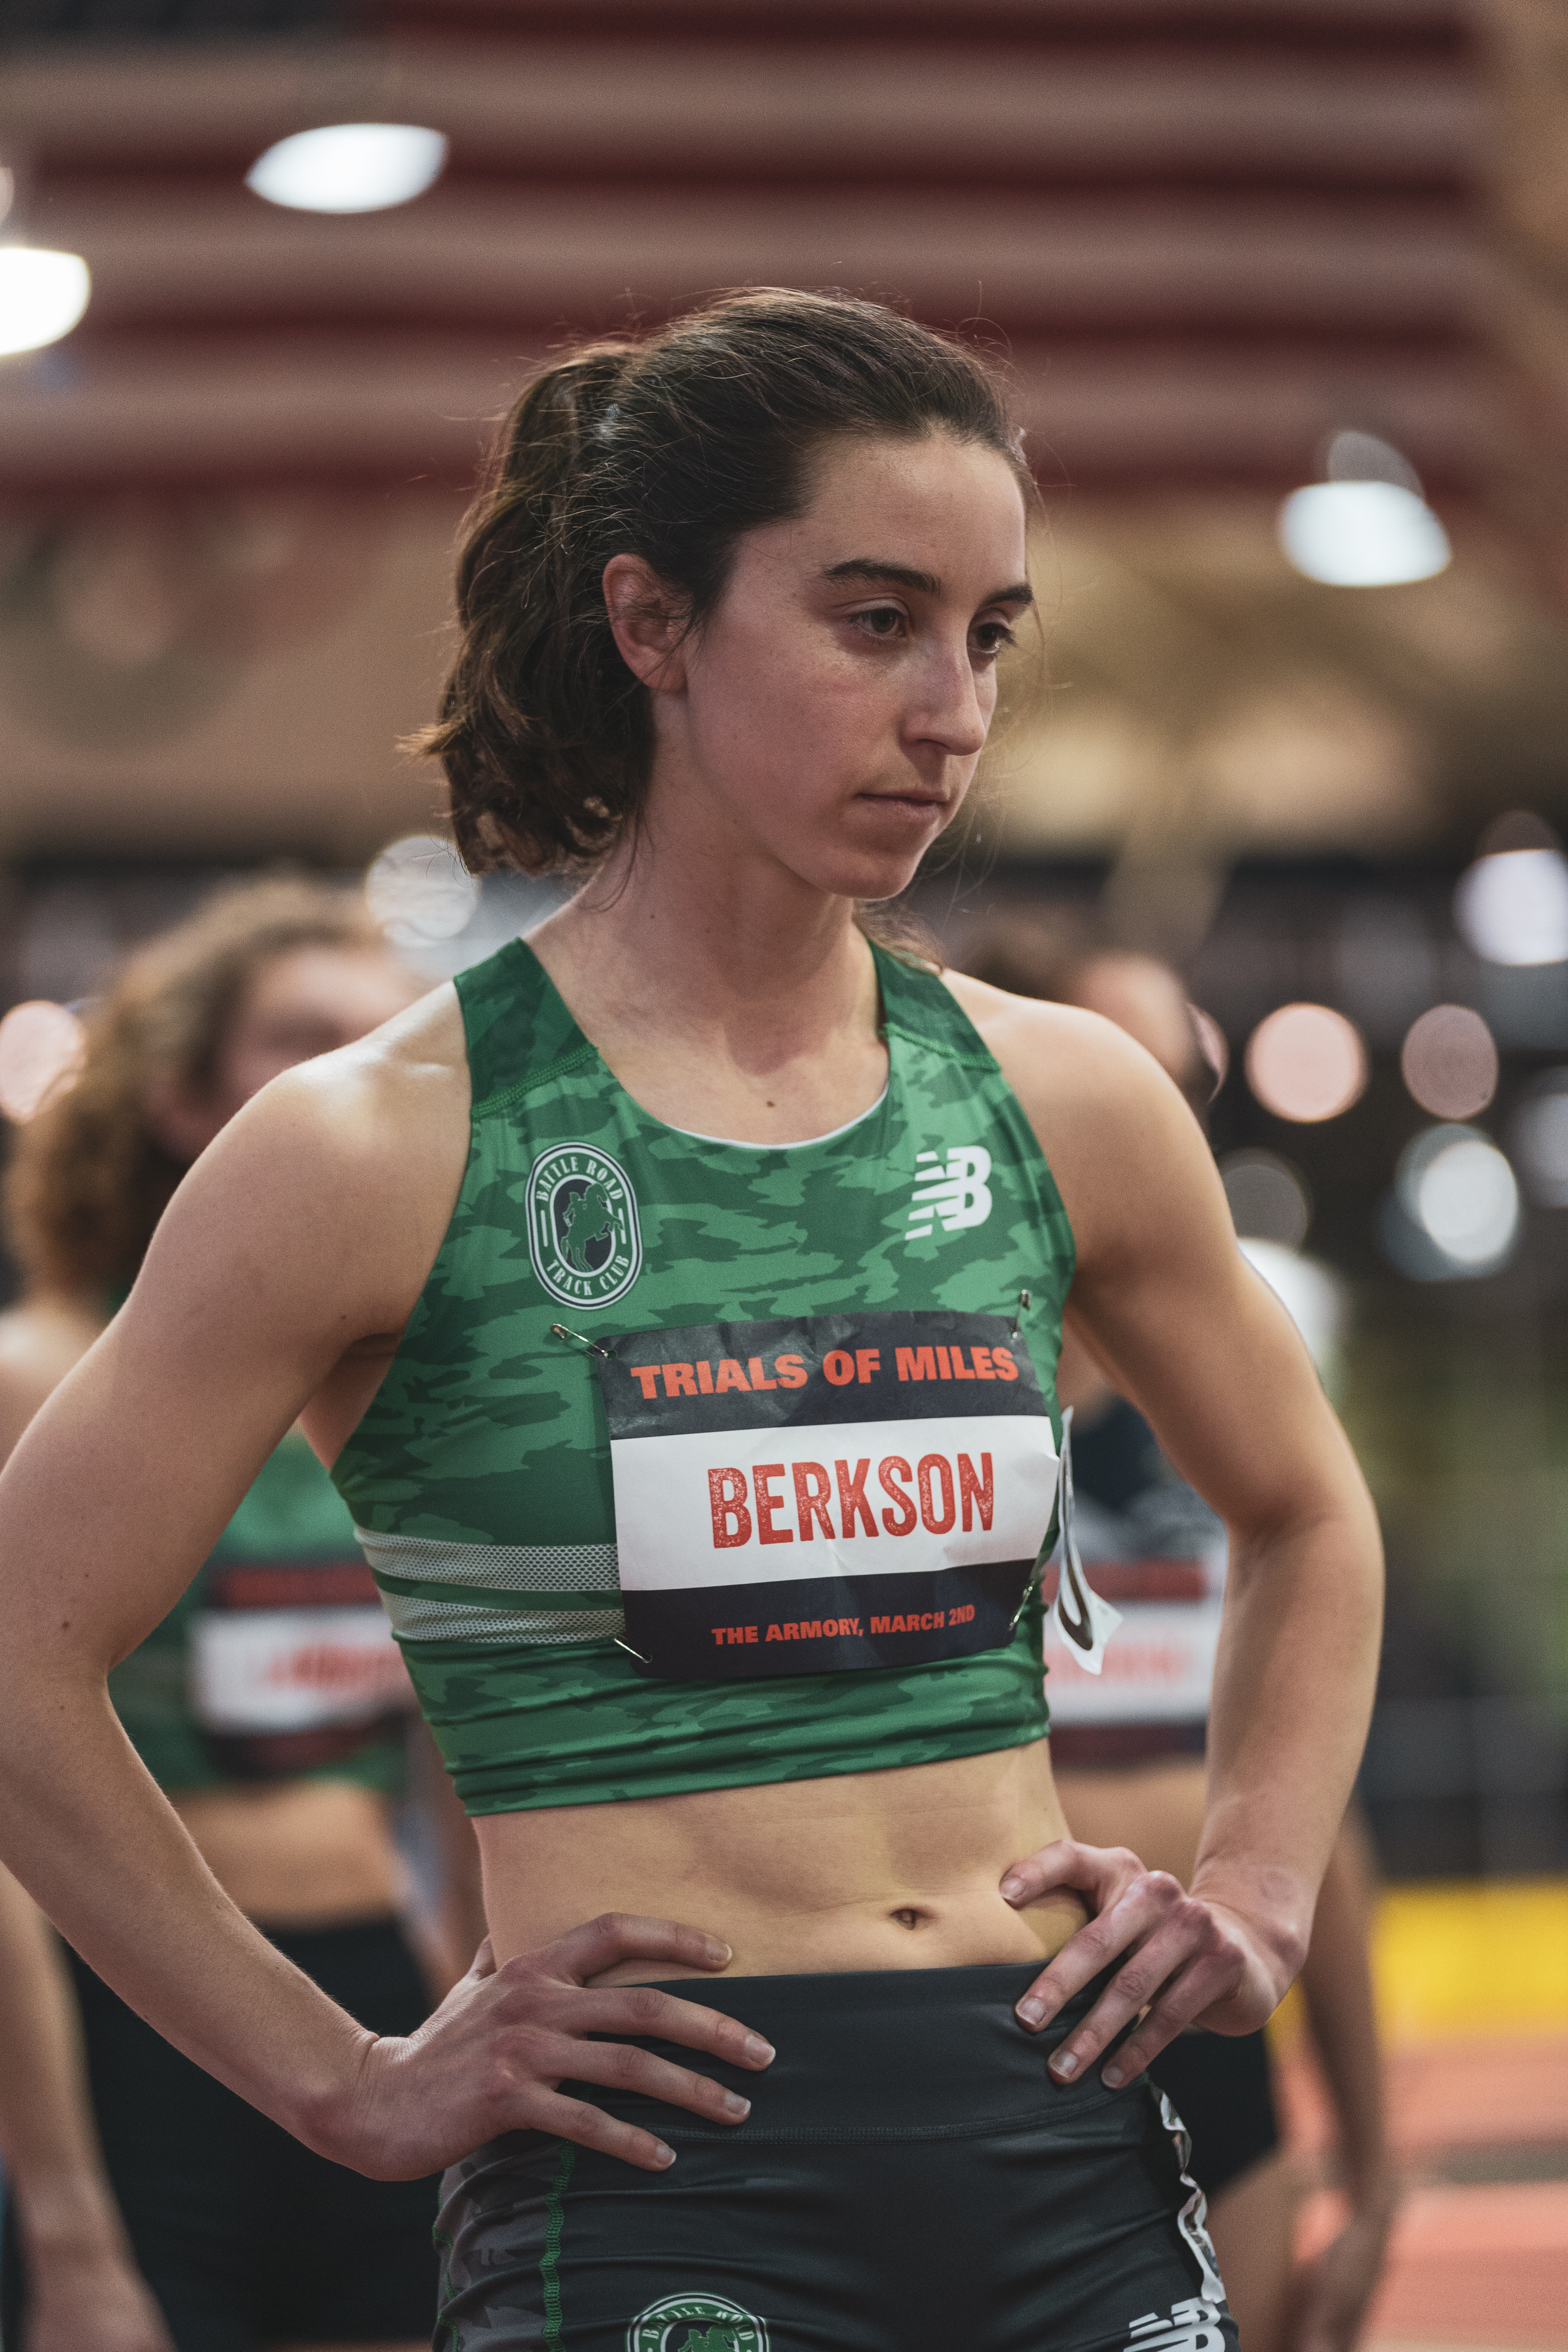
1,000m 2:41 (2:40) 800m 2:06 (2:04) Mile 4:42 (4:30) 800m 2:06 (2:03) Photo at left taken moments before race by Mo Fetouh There were big differences between the times run and the goal times, particularly in the mile which was my main focus for the season. During that race, my legs felt heavy and tired. What happened? I’m still trying to figure it out, but the day after the mile race I did a simple analysis comparing race performance with timing of hard efforts preceding the race. My theory was that I was tired from three consecutive weekends of racing and pacing, plus workouts in between. Although I felt fine in daily life leading up to the race, the accumulated fatigue may have manifested in the few percentage points that separated the time I ran from the time I expected. Data from the past three years support this idea.
My full report is on my website here but the main findings are in the below plot. The y-axis is race quality on a scale of 1-4, 1 being a terrible race and 4 being a great race. The x-axis is days elapsed since the penultimate all-out effort (race or hard workout). I found that looking at the last two hard efforts was less noisy than looking at the last hard effort before a race. It also encompasses more information. Green circles are the averages for each race quality category, and the grey dashed line is a trendline. I analyzed 27 races, roughly equally spread across the four quality categories.
I found that terrible races (quality 1s) had an average of around 9 days since the last two all-out efforts. Great races (quality 4s) had 14 days since the last two all-out efforts. This may seem obvious in retrospect, but it’s helpful to have the day averages to inform future training near races. Plus, some fatigue is necessary during training and not every race can be a quality 4 race during a long season.
-
Other data
I enjoy collecting and visualizing data like this. In fact, I think it’s an essential technique for answering many of life’s questions. For example, a few years ago I was having chronic stomach pain that prevented me from sleeping. Doctors weren’t really able to help but suggested it might be food-related and that I keep a food journal to track my food and symptoms. I kept such a journal (excel spreadsheet) for a little while but it was hard for me to identify trends just by reading my notes. I looked around for better tools for doing this but didn’t find any. Eventually, I decided to upgrade my food journal by making a computer program that would allow me to log and visualize foods eaten alongside stomach symptoms. I used the program to meticulously document my food and stomach for a few months.
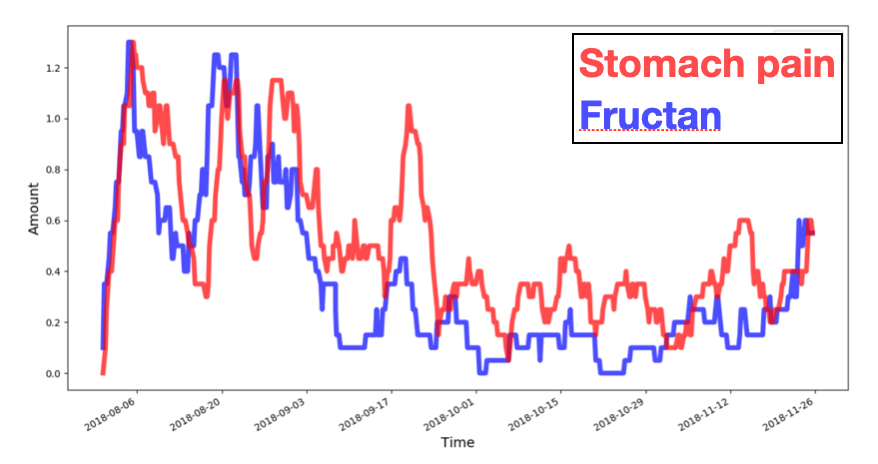
I began to notice trends when I plotted certain foods against stomach pain. When I cut those foods out of my diet, my stomach pain quickly subsided. Again, it seems like an obvious result in retrospect but it is hard for the human brain to associate pain with food eaten, for example, 8 hours prior, and to distinguish which of the many different foods eaten that day is the culprit. Below is an example of one of my plots that relates stomach pain with a compound that is in gluten:
In my free time, I’ve been working on improving the program and making it commercially available. I meet a lot of people with nebulous, chronic stomach issues and I think the tool might be useful to others. If you or someone you know is interested in this, let me know if you have suggestions or feedback. I am a believer in collecting and visualizing data on all kinds of things but meticulous data collection does require a certain type of compulsion which may not appeal to everybody. Maybe a clever computer program can broaden the appeal.
-
Outdoor track season
I’m now looking forward to the outdoor track season. The weather is getting nicer and I’ll be able to see if my training and data analysis bears fruit. As planned, I’ve been spending more time and focus on training: I do more in the gym, I run more mileage per week, I do higher quality running workouts, I never start a run hungry or in the dark, I do yoga regularly, and I sleep a lot. Below is my tentative racing schedule for the spring. The main goal is to run under the Olympic Trials automatic qualifying time of 4:06 for the 1500m. My current best is 4:10.
Date Race name Event(s) Location April 12-13 Brian Clay Invitational 1500 and maybe 800 Los Angeles, CA April 19-20 Mt. SAC Invitational 1500 and maybe 800 Los Angeles, CA May 3 Trials of Miles at Icahn 1500 or 800 NYC May 18 Battle Road Twilight Meet #2 800 Weston, MA June 1 Music City Track Carnival 1500 Nashville, TN June 21-30 Olympic Trials 1500 Eugene, OR Here are a few shots of winter training, in all its glory.
-
A frigid tempo run on the streets of Providence Deadlifts in the home gym Relaxing with Left Hand of Darkness on the Kindle


